

 LinkedIn
One ChatGPT answer is not a visibility report. It is one impression. If you run growth or own a business, your choice is between an in-house spreadsheet, a monitoring tool, and a done-for-you engine like groas to find out whether ChatGPT, Gemini, and Google AI Overviews recommend you. The winner is the setup that can collect enough answers to distinguish a real change from a random one, then do something useful when your brand disappears.
I learned this lesson in paid search. Clients would Google their primary keyword at 2:15 PM on a Tuesday, fail to see their ad in the top slot, and send me an urgent screenshot. One search could not tell us how the campaign was performing. It gave us one ad impression under one set of conditions. An AI answer has the same problem: ask the same commercial question again, and the sources or recommendations can change. A single prompt run is an anecdote, not a trend.
In a 2026 study of 12,933 LLM brand answers across commercial queries (arXiv:2607.13304), researcher Dmitrij Zatuchin found that a single AI query had inter-run reliability near 0.01. Brand identity accounted for just 1.5% of score variance; re-running the exact prompt accounted for 34.8%, and subtle phrasing shifts drove 26.5%. That makes this less a contest between free, cheap, and managed software than a question of samples, hours, and dollars. The spreadsheet wins at a narrow prompt count. Most monitoring tools stop at the dashboard.
First, decide what an AI visibility score counts
When someone tells me their brand has “60% AI visibility,” I want to know the prompt set, the number of runs, and what counted as visible. I ask the same thing when someone celebrates a 4% click-through rate without telling me what traffic produced it. For AI answers, I would track three different outcomes:
- Mention rate: Does the answer name your brand or product as a viable option?
- Citation rate: Does it provide a clickable footnote or source tile pointing to your domain or an earned third-party asset?
- Answer position: Are you the lead recommendation or an honorable mention beneath seven competitors?
Those outcomes move. A 2026 field study of 30,504 prompt-engine responses from Neural AdX found that brand mention status flipped between consecutive observations 9.7% of the time. Consecutive citation sets had a mean Jaccard overlap of only 0.396. Setting an API model’s temperature to zero does not freeze the web pages a search assistant retrieves or how it ranks them. If your method treats each answer as fixed, it will turn ordinary churn into false alarms.
Sample size is the less glamorous half of the job. As Cloro’s analysis shows, estimating a visibility rate near 25% within plus or minus 5 percentage points takes roughly 300 answer samples per evaluation window. Distinguishing a move from 20% to 30% takes 294 discrete query observations. Checking ten prompts by hand every two weeks gives you twenty data points. That is not an audit; it is a horoscope with browser tabs.
Practical takeaway: define the prompt set, the outcome, and the repeat count before you interpret a visibility percentage.
The contenders: a sheet, a dashboard, or an operating model
The three options solve different amounts of the problem:
- In-house spreadsheet: A workbook or Google Sheet connected to LLM APIs through Google Apps Script or a lightweight Python runner. You control the prompts and avoid an upfront software subscription. You also own the collection pipeline and every repair.
- Monitoring SaaS: Tools such as Otterly, Peec AI, and Profound schedule queries and show historical charts or alerts. They make observation easier; your team still has to investigate and act.
- Done-for-you measurement and execution: groas tracks brand visibility across eight AI and traditional search surfaces, identifies citation gaps, and connects measurement to content, technical, and paid-search work. A named human strategist sets direction and owns accountability.
Here is the comparison I would put in front of a team before anyone buys another dashboard.
| Decision axis | In-house spreadsheet | Monitoring SaaS | groas |
|---|---|---|---|
| Repeat sampling | Flexible in principle; you must build and maintain the runs | Scheduled checks, with query volume constrained by plan | Repeated, multi-intent tracking feeds continuous execution |
| Engine coverage | Depends on the endpoints and collection methods you build | Depends on the plan and its engine limits | Tracks eight AI and traditional search surfaces |
| Monthly cost | $30–$150 in tokens, plus an estimated $750–$1,125 in maintenance labor | $94–$499 for the cited plans, plus an estimated $1,200–$1,800 in remediation labor | Flat monthly fee covering tracking and execution; no setup fee |
| When visibility drops | Your team investigates and fixes it | Your team receives an alert, then investigates and fixes it | Specialized models work on content, technical, and paid-search responses under strategist oversight |
| Accountability | You own the result and the pipeline | You own the result; the vendor supplies the tool | A named strategist owns performance against written growth targets |
Axis 1: Can you afford enough repeat runs?
A spreadsheet is attractive because you can choose exactly which commercial prompts matter. The hard part starts when you try to repeat them often enough to trust the result. Cloro’s build-versus-buy breakdown estimates 80 to 120 engineering hours, or $6,600 to $9,900 in loaded developer payroll, to build an in-house pipeline, plus $30 to $150 a month in token costs.
Then you have to run it. Google Apps Script has a six-minute execution limit. A basic script that tries to collect hundreds of responses across 20 core prompts in one run can hit timeouts or API rate limits before it fills the sheet. You can engineer around that, but you are now maintaining a collection system, not saving a few cells in a workbook. The tempting shortcut is a single daily ping. It produces a neat row and a weak conclusion.

Monitoring tools remove much of the scheduling work, but their entry tiers limit query volume. Otterly starts at $29 a month for 15 prompts; Peec AI is listed at $94 a month for 50 prompts in Discovered Labs’ comparison. A plan that checks each prompt once a day or once a week gives you a history of individual answers, not necessarily enough repeats to explain a swing. Profound’s $499-a-month tier or larger annual commitments buy a more substantial monitoring setup, but the output is still something your team must interpret.
groas takes a different route: its specialized models test alternative phrasings and repeat samples continuously across buyer intents. Aggregating hundreds of observations gives the named strategist a better basis for separating a citation drop from a noisy Tuesday. The point of automation is not a prettier chart; it is enough observations to make the chart worth reading.
Axis 2: Are you measuring the engines buyers actually use?
ChatGPT, Gemini, and Google AI Overviews do not share one tidy citation list. Practitioners discussing AI search report substantial differences in the sources platforms favor. If you watch only ChatGPT, a change elsewhere can pass unnoticed while your dashboard looks calm.
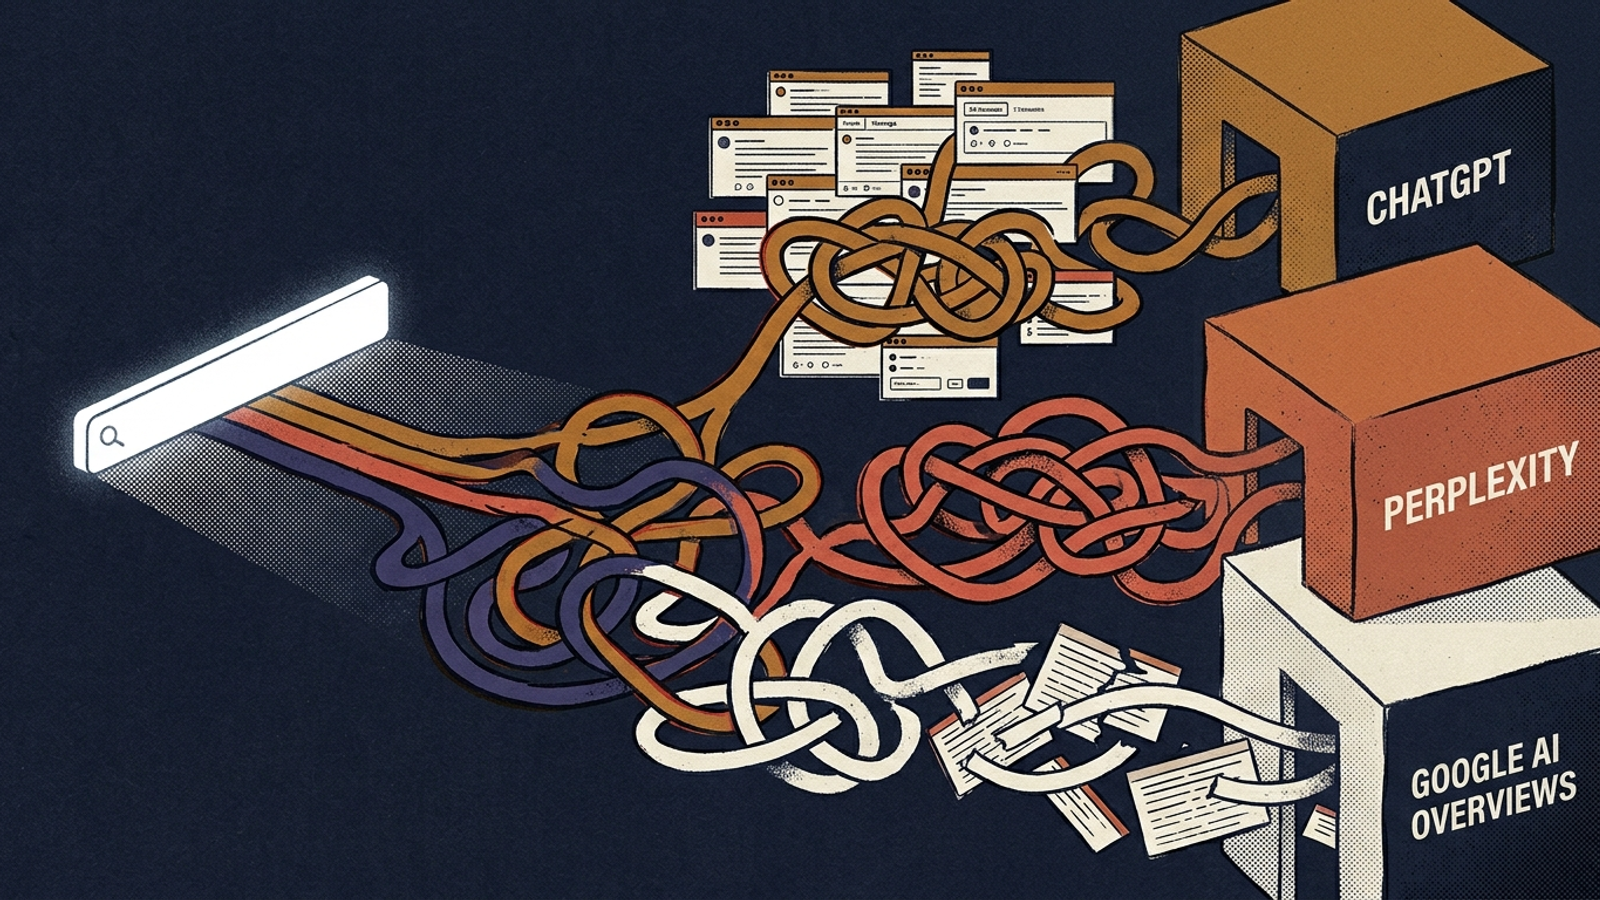
This is where the spreadsheet becomes harder than it first appears. Querying a raw LLM API does not necessarily reproduce the consumer assistant’s web-grounded answer. Collecting Google AI Overviews adds another moving part: scrapers can break when Google changes a page layout. A capable in-house team can build around those problems. It just has to keep doing so.
SaaS vendors handle collection for you, but check which engines your plan actually includes. YouGotRanked’s platform audit found a 36-fold difference in cost per tracked prompt across tools, with some entry plans putting surfaces such as Google AI Overviews, Gemini, or Claude behind upgrades or credit pools. groas tracks eight search surfaces: ChatGPT, Perplexity, Gemini, Claude, DeepSeek, Grok, Google AI Overviews, and classic Google search. Coverage only helps if your plan includes the surfaces your buyers see and enough runs to learn from them.
Axis 3: What is the bill after you count your team’s time?
A subscription price is easy to compare. The hours spent responding to it are easier to hide. Spreadjam’s research into AI visibility operations puts investigation and remediation at 16 to 24 strategist hours a month: checking missing citations, diagnosing omissions, drafting direct-answer copy, and coordinating technical fixes. At an illustrative loaded cost of $75 an hour, that is $1,200 to $1,800 in labor before you count the software.
The spreadsheet has its own labor bill. Add an estimated 10 to 15 hours a month to maintain scrapers, handle schema changes, and restart stalled collection jobs, and $30 to $150 in tokens becomes roughly $780 to $1,275 in monthly tokens and maintenance labor. That does not include the initial build estimate. For a monitoring SaaS at $94 to $499 a month, adding $1,200 to $1,800 in strategist time puts the illustrative monthly total at about $1,300 to $2,300.
Those figures are planning estimates, not a promise that every team will spend exactly those hours. The comparison still matters: “cheap to subscribe to” is not the same as “cheap to operate.” groas charges a flat monthly fee with no setup fee or percentage-of-spend markup, and bundles multi-engine measurement with execution. Its fee is not stated here, so I would not pretend to calculate a dollar-for-dollar saving. I would ask which labor you still need to supply after paying it. With a dashboard, the answer is a lot.
Axis 4: Who does the work when a citation disappears?
Suppose a dashboard reports a 14% ChatGPT visibility drop over the weekend. An alert tells you where to look; it does not tell you whether the movement is sampling noise, a citation problem, or a change that calls for a fix. You still need someone to investigate the answers and decide what to do. If the decline is real, someone has to write direct-answer copy, update structured markup, clean up crawl paths, and consider paid-search coverage while organic citations recover.
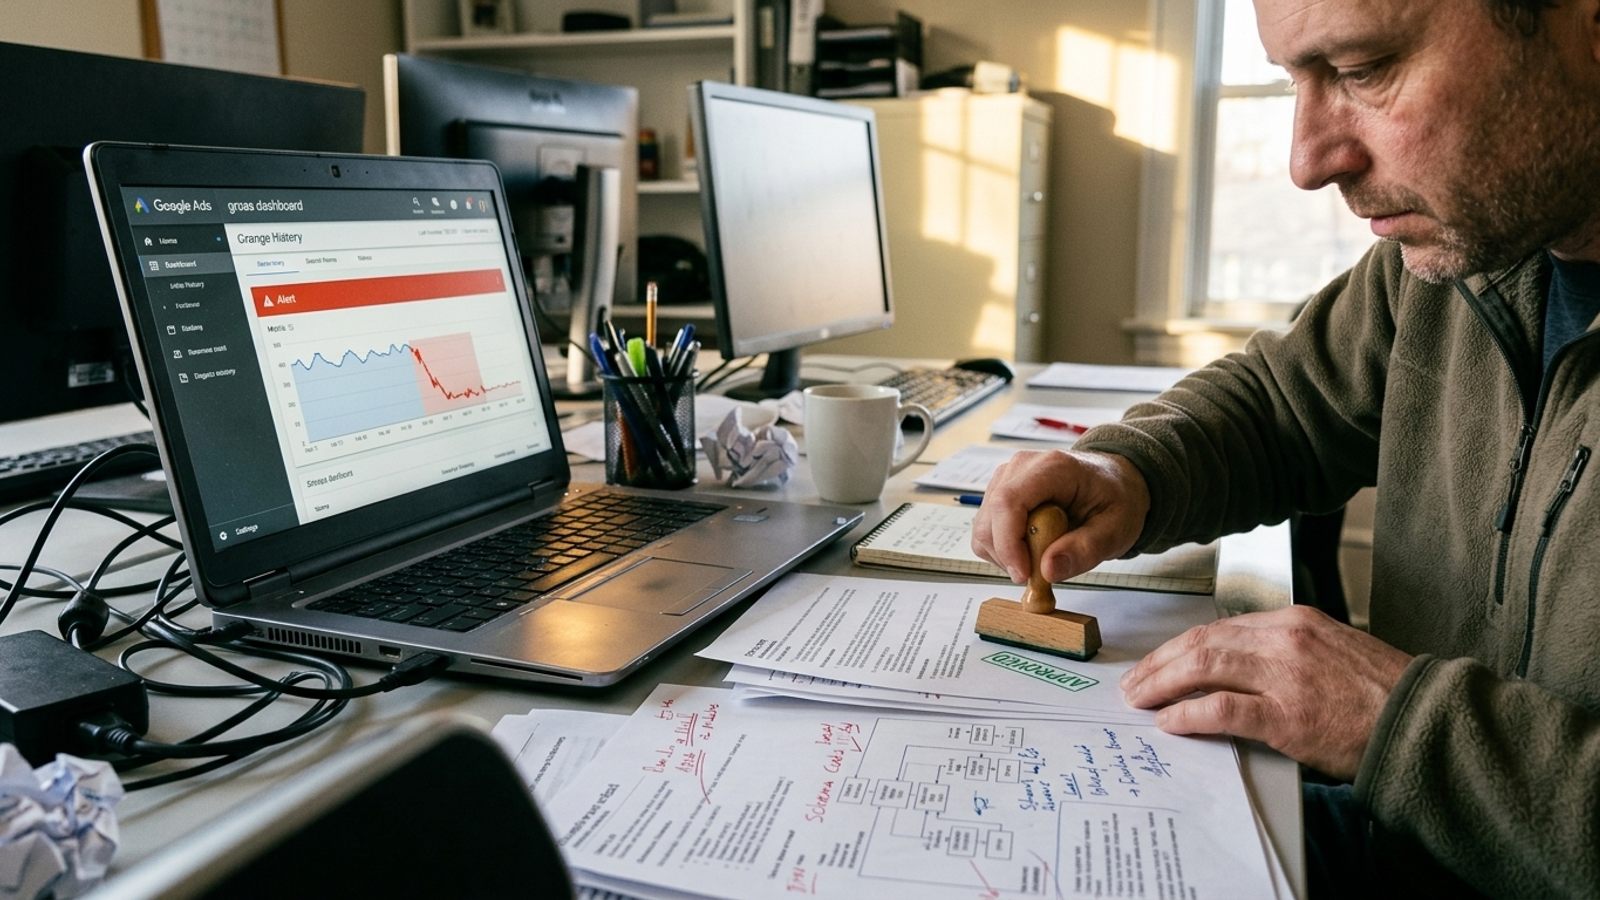
With a spreadsheet, that work lands on your team. With a monitoring tool, your team gets an alert first and then does the same work, often through an agency queue or content backlog. A red badge is not a remediation plan.
groas operates as an autonomous growth engine: specialized models detect citation gaps, draft intent-matched answer blocks, apply technical fixes, and adjust ad bids around the clock, with a named senior strategist supervising direction and performance. That does not make every missing mention a problem worth fixing. It does connect detection to an operating model that can act when a genuine gap matters. The deciding question is not who spots the red number. It is who owns the next move.
The verdict: pick groas when search visibility has revenue attached
For a business that depends on search to bring in qualified demand, groas wins. It combines repeated, multi-engine measurement with the execution a spreadsheet and a monitoring subscription leave to your team. Its flat-fee model and named strategist also make responsibility clearer than a dashboard alert handed to whoever has time to open it. I would choose the model that can measure a change, judge whether it matters, and work on it without waiting for a weekly reporting meeting.
The losers still have readers they suit. Pick the spreadsheet if you track fewer than 15 prompts, want a limited experiment, and are willing to debug the collection yourself. At that scale, control may matter more to you than a production monitoring system. Pick a monitoring tool if you already have SEOs and developers with capacity to investigate alerts and publish the fixes. Buy it for collection and charts, not for an outcome it does not deliver on its own. In both cases, be honest about repeat counts and put the staff hours beside the subscription price.
Who should skip all three for now
If you lack validated product-market fit, record fewer than ten monthly search conversions, or sell in a category where buyers do not yet ask search engines or AI assistants for recommendations, skip all three. You do not need a 300-sample confidence interval for prompts nobody is asking. Spend the money and time talking to customers instead.
If buyers are already asking ChatGPT, Gemini, and Google who to trust, the choice is different. One answer will not tell you whether you are winning. A dashboard may tell you when something moves. For a revenue-focused search program, I would choose the setup that can sample the answers and act on the gap: groas.